UK Pay Trends 2026: Pay Award Forecasts and What HR Leaders Should Do
.jpeg)

The headline for 2026: most employers are planning pay increases of around 3%. That's a return to stability - the same 'steady year' increase reward professionals would recognise from pre-pandemic years. Expect tighter governance and more scrutiny on whether your pay decisions are actually landing in the market.
For HR and Reward leaders, though, that headline number is only part of the story. Another minimum wage increase, pay transparency pressure, and sector-specific talent hotspots will push real outcomes up or down depending on who you employ and where.
This guide breaks down what happened in 2025 using official wage growth data from the latest ONS AWE release, what 2026 pay budgets are signalling in employer surveys like our UK Pay Trends 2026 report, and what I’d do if I were running your pay review this year.
Key Takeaways
- Most employers are planning pay awards around 3% in 2026, according to the HR DataHub UK Pay Trends 2026 report.
- Sector expectations vary meaningfully, so you need to sanity-check “average” figures against your own talent risks using live market signals (e.g., Finance salary trends vs Retail salary trends and Logistics salary trends based on HR DataHub’s job-ad dataset).
- Wage growth and pay awards are not the same metric. Official wage growth is running higher than typical pay budgets, with private sector regular pay growth at 3.6% and public sector at 7.9% in the latest ONS AWE data.
- Real pay gains will be modest unless inflation undershoots. UK CPI inflation is forecast at 2.5% in 2026 in the most recent OBR Economic and Fiscal Outlook.
- The cost floor is still rising: the National Living Wage increases to £12.71 from April 2026, and employer costs remain elevated
- Pay compression is the retention risk most teams underestimate, especially in hourly-heavy sectors already exposed to NLW increases.
2025 pay trend recap: What actually happened?
Last year’s numbers came in higher than forecast. Most pay award surveys predicted increases around 3%, but the latest ONS figures put wage growth at 4.5% for regular pay and 4.7% for total pay at the end of 2025.
The public and private sectors have been moving at very different speeds. Public-sector regular pay growth was 7.9%, while private-sector regular pay growth was 3.6%. The ONS flags timing and base effects from public-sector awards paid earlier in 2025, but it's still a meaningful gap.
Sector performance wasn't uniform either. After the public sector, the strongest regular-pay growth was in wholesaling, retailing, hotels and restaurants (5.1%), while finance and business services came in lowest at 2.2%. What's interesting is where the pressure showed up: wage-floor sectors saw stronger growth, likely NLW-driven, while white-collar sectors stayed cooler.
The labour market in general cooled through late 2025 as well. Payrolled employees were down 155,000 year-on-year and down 33,000 month-on-month. In pay terms, that typically shifts the emphasis from broad retention spend to targeted decisions where you still have genuine scarcity.
What was real wage growth vs inflation in 2025?
Your employees don’t experience nominal pay growth. They only get to see what actually makes it to their pocket after inflation.
Between September and November 2025, inflation measured by the CPIH (Consumer Price Index with Housing costs) averaged 3.8%. Adjusted for CPIH, real regular pay grew 0.6% and real total pay grew 0.8% in 2025. Not something your team will be recounting to their grandkids.
If your pay awards cluster around 3%, the real improvement can remain thin, so structure and targeting matter more. Protect the key differentials, keep hot roles in the market, and avoid silent drift through exceptions.
My take on inflation in 2026? Use the Bank of England’s forecast path. In their November 2025 Monetary Policy Report, the Bank stated that its goal is to get inflation back to the 2% target and keep it there. Policy will likely ease gradually if the disinflation trend continues.
What is the pay trends forecast for the UK in 2026?
For most organisations, around 3% is the realistic baseline for 2026 pay awards. This year the difference between a smooth pay round and a painful one won’t be the headline number. It’ll be where you spend your budget: the roles that are moving fastest, the locations where you’re getting outbid, and the grades where compression is building.
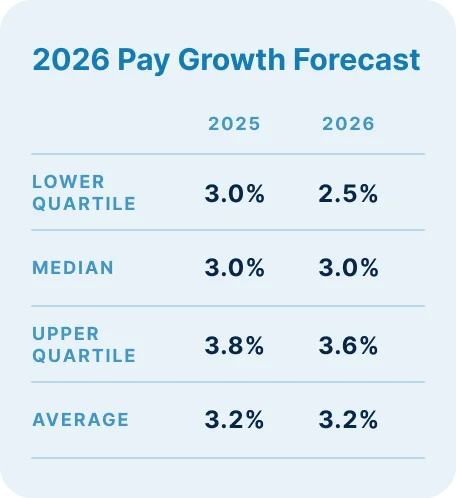
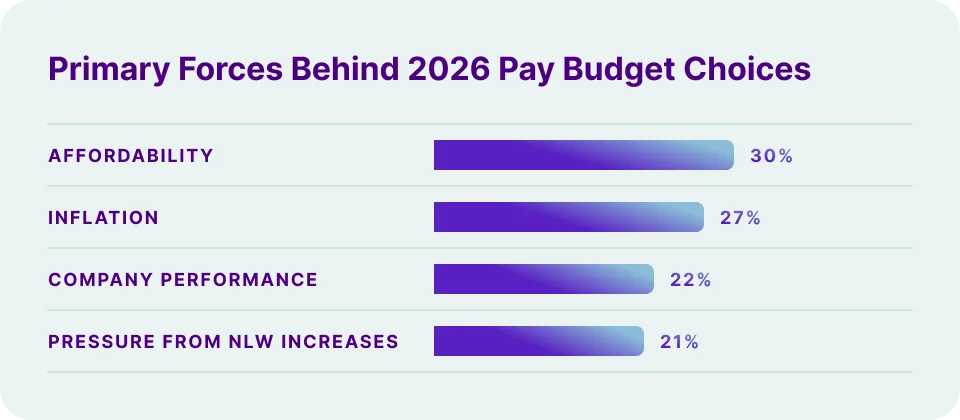
Our 2026 Pay Planning Survey (involving over 200 UK organisations) shows a 3.0% median pay increase for 2026, with a 3.2% cross-sector average. The main forces behind pay budgets are still affordability (30%) and inflation (27%), with pressure from NLW increases (21%) now almost level with company performance (22%).
One useful takeaway from the survey is this: the median is flat, but the range is widening. While overall averages remain consistent at 3.2%, the lower quartile increases from 2.5% to 3.0%, while the upper quartile shrinks slightly from 3.8% to 3.6%. Be ready for stretched budgets at the extremes, even though the headline looks steady.
Two more things to take seriously before you lock your approach:
- A lot of employers are defaulting to “same for everyone.” 42% are planning flat-rate increases, versus 14% using market position, 14% using individual performance, and 18% using a matrix of both. Flat rates are simple, but they’re also how you quietly drift off-market in the roles you most need to hold onto.
- Union vs non-union is unusually aligned this year. Our survey shows 3.2% settlements across unionised sectors, broadly matching non-union outcomes, meaning less of the “union premium” many teams are used to budgeting for.
One final thing to keep in mind: wage growth isn’t the same thing as pay awards. Official wage growth can move because of overtime, bonuses, and workforce mix, as well as your annual base-pay review decisions.
What is the 2026 average pay rise by sector in the UK?
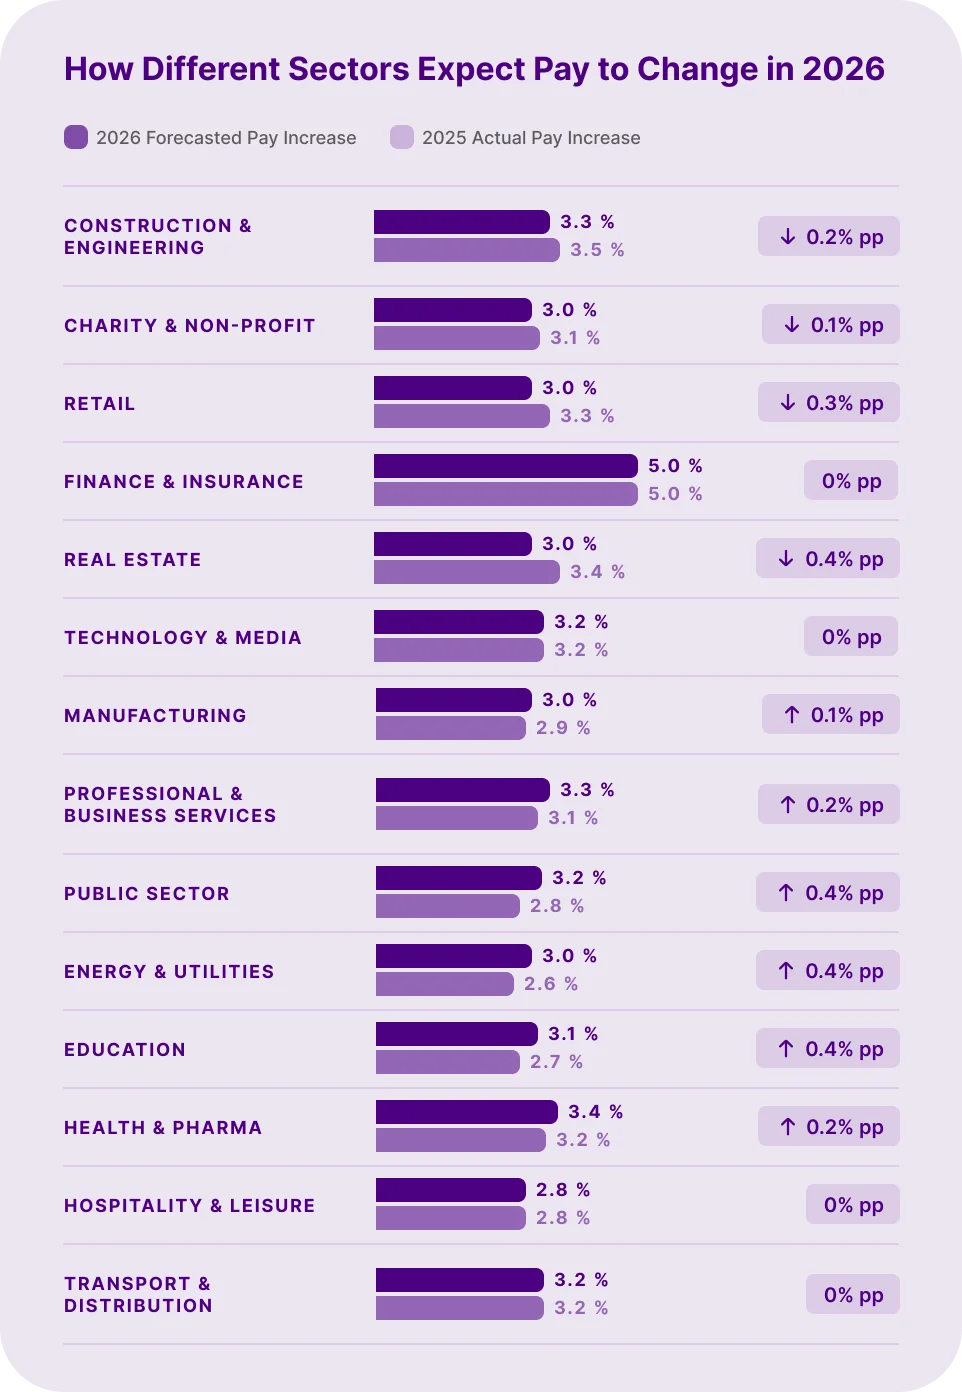
Sector averages matter more than the headline 3%. Finance leads at 5.0%, while Hospitality sits at 2.8% - a 2.2 percentage point gap that reflects very different talent markets, wage floor exposure, and retention pressures.
Here's what HR DataHub's survey shows for 2026, plus the live market signals you need to watch in each sector:
Tech & media
2026 forecast: 3.2%
Scarcity is still role-specific (AI/data/cyber/product), where you can end up paying more than planned long before you feel it in your annual review.
Don’t let a flat budget force you into reactive counteroffers you can’t really afford - use role and location salary benchmarks to stay ahead.
Professional & business services
2026 forecast: 3.3%
Pay is managed through base plus variable, but pressure concentrates in specific capabilities and senior grades. The risk: offer drift above midpoint - especially where client-facing roles compete with consulting firms.
If it keeps happening, find out how to structure your salary bands properly and introduce guardrails instead of approving more exceptions.
Retail
2026 forecast: 3.0%
Wage floor pressure and NLW-driven compression hits hardest here. NLW rises again to £12.71 from April 2026, lifting entry-level rates - but supervisor and team leader rates often lag by 3-6 months, creating retention risk in the operational layer you most need.
Fix supervisor differentials in April when frontline rates move, not later when retention problems appear.
Hospitality & leisure
2026 forecast: 2.8%
Lowest increase, highest churn. Wage floor pressure creates rapid compression between front-of-house, kitchen staff, and shift supervisors - often within weeks of the April NLW rise.
Budget pressure shows first in hours and scheduling, then retention. Watch advertised hourly rates for chefs, FOH leads, and night staff - if they move 50p-£1/hour above your rates, you're about to feel it.
Transport & logistics
2026 forecast: 3.2%
National averages mask local volatility. A warehouse supervisor rate that works in Doncaster fails in Milton Keynes, where logistics density creates bidding competition.
For warehouse supervisors, planners, fleet maintenance, and HGV-adjacent roles: benchmark by 20-30 mile radius, not national averages. Local competition sets the price.
Finance
2026 forecast: 5.0%
Highest sector increase - and it understates the reality for specialist roles. Regulated roles (compliance, risk, audit) and technical skills (quants, actuaries, data) command significant premiums to retain capability, even when wider markets cool.
Don't benchmark generalist finance roles and specialists in the same pool. They're different labour markets with different price points.
UK regional pay: how to set location-based salary ranges in 2026
Location premiums didn't disappear with hybrid work. London roles still command higher rates than regional equivalents, though the gap varies significantly by role type and actual commuting expectations. Don't use blunt 'London weighting' policies. Benchmark by role and location radius, especially for roles where employers expect regular office attendance.
When location premiums matter most:
- Office-based roles with 3+ days on-site: London commands 10-20% premiums over Manchester, Birmingham, or Leeds
- Specialist roles in high-density sectors (finance, tech, media): location concentration drives local bidding
- Entry-level roles: cost of living differences show up fastest in retention for lower-paid grades
When location premiums compress:
- Fully remote roles with no office requirement: national market pricing becomes the norm
- Senior leadership roles: premiums flatten as national/international talent pools compete
- Tech roles where remote work is standard: location matters less than capability
Use live market data by role and radius, not historical internal salary records. What you paid two years ago tells you nothing about what the market expects today - especially in locations where commuting patterns shifted to hybrid work post-pandemic. 10% of employers are planning to increase hybrid working, and 72% are keeping it as is, so it’s part of the new normal.
How does the National Living Wage increase affect pay budgets?
The 2026 pay cycle isn’t being driven by market pay alone. Rising employer costs are doing a lot of the heavy lifting. Employer NIC rates rose from 13.8% to 15% in April 2025, the Secondary Threshold fell in 2025 to £5,000 per year, and the NLW is going up again to £12.71 from April 2026.
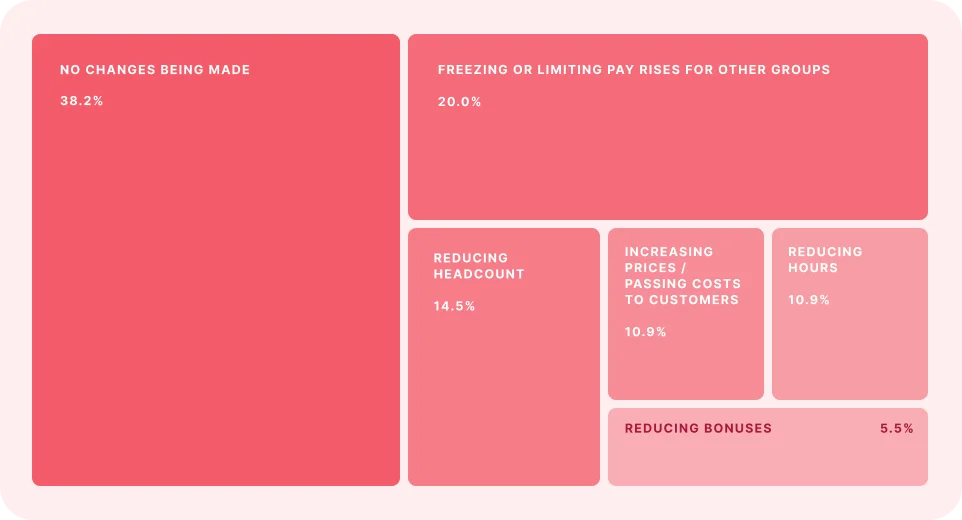
In our pay planning survey, 71% said NLW growth is having a significant impact. And among organisations with a high NLW employee base, 20% said they were freezing recruitment or limiting pay rises for other groups.
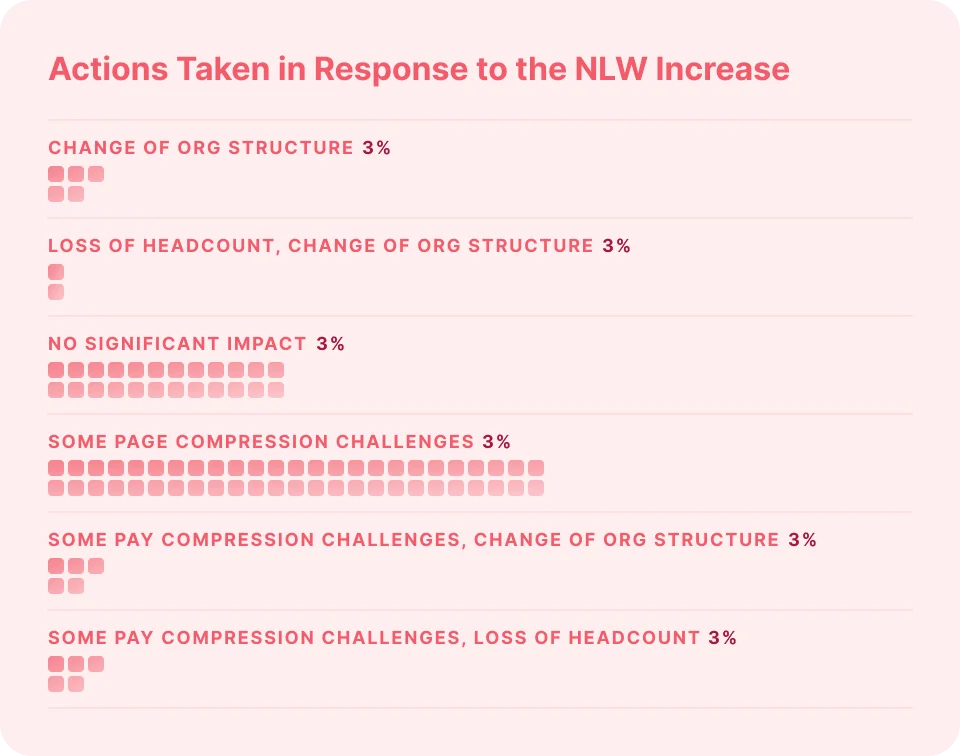
That’s the reality for a chunk of employers: rather than lifting pay awards across the board, they’re looking for headroom elsewhere by tightening hiring plans or limiting increases for other groups.
So, before you lock in awards, work out what the NLW and NIC changes will add to the cost of your lowest-paid grades. Then decide up front where the remaining budget is allowed to go. I’d advise prioritising targeted top-ups for roles you can’t afford to lose, and a small, clearly controlled pot for promotions and genuine off-cycle cases.
Why do minimum wage increases cause pay compression?
Pay compression: when the gap between job levels shrinks, increased responsibility stops being meaningfully rewarded. Our analysis shows it’s more likely after NLW uplifts
In 2026, this is your biggest pay risk. When the wage floor rises, entry-level rates move up first. If you don't also adjust the next layer - team leads, supervisors, specialists - the differential compresses and you’ll start losing your more experienced people.
The answer isn’t a stream of one-off exceptions every time someone threatens to leave. Put a solid pay structure in place: clear salary bands, progression rules, and market anchors so you can protect key differentials consistently and justify decisions when managers push for off-cycle increases.
If you can’t afford to fix compression everywhere, fix it where it hurts retention and capability the most. Identify the roles where loss creates operational fragility. Defend those differentials in April when NLW moves, not six months later when retention problems crop up.
What should HR leaders do when reviewing their UK pay strategy for 2026?
If you want a pay review that holds up to employees, leadership, and the market, run it like a tight decision process, not an arcane annual ritual. Our survey shows that 2026’s biggest pay strategy priorities are carefully managing your pay budgets, retaining critical talent, and reviewing pay structures.
1) In the next 30 days: get market truth for your riskiest roles
Start with the roles where being wrong is expensive: hard-to-hire jobs, high-turnover teams, and any grade likely to feel NLW-driven compression.
Use consistent rules (job scope, seniority, location radius) and benchmark against current advertised pay in the live market. Pair that with a quick structure check: do your bands still make sense, and do managers know how to use them?
2) Over the next quarter: tighten pay governance without slowing down hiring
Most pay teams are heading into 2026 with limited room for error, and flat-rate approaches are a common stopgap when budgets are tight despite the potential issues.
Your job in these situations is to prevent silent drift: define when you will make off-cycle moves, who signs them off, and what evidence counts as “market.” Then make it easy for managers to do the right thing with clear ranges, clear progression rules, and a simple escalation path when an offer is genuinely out of band.
3) For annual planning: assume pay transparency pressure will keep rising
Pay transparency is shifting from a nice to have to an expectation. In our survey, 71% of employers have implemented pay transparency or plan to.
Even if you’re not ready to publish ranges everywhere, behave like you plan to: document your pay logic, clean up job levelling, and make sure your ranges are defensible by role and location.
4) Use benefits to reinforce retention, not to paper over pay problems
When pay budgets flatten, benefits matter more - but only if they match real needs. Our survey shows broad adoption and planned growth in mental health support and menopause support in 2026, alongside other health-related benefits.
Treat benefits as targeted retention levers for the groups you’re most likely to lose, while you fix the underlying pay structure and compression risks.
Get live UK salary data before you finalise your 2026 pay review
If you want to sense-check your 2026 pay decisions before they turn into a retention problem, start by benchmarking the roles where drift is most expensive: scarce skills, high-churn teams, and the grades most exposed to compression.
Use HR DataHub to benchmark by job title and location using live UK job ad data, then pressure-test your ranges before awards are locked. Try the free trial, or book a short call to walk through your use case to see how we can help you get ahead of 2026’s pay trends.

LATEST WEBINAR

View our library of resources tailored to help you do X, Y & Z


Read through more blogs
.jpg)

%2520(1).webp)


.jpeg)


.jpeg)


.jpeg)


.avif)
.webp)
.avif)
.avif)
.avif)
.webp)
.webp)
.webp)
.avif)