Retail turnover rate (UK): What it is, how to calculate it, and strategies to improve retention in 2026

If you’re constantly hiring just to stand still, your retail turnover rate will tell you why. I look at it to see where people are leaving - which stores, which roles, and how quickly - because that’s where the real problems usually sit.
I’ll break down what retail turnover rate actually is, how to calculate it properly, and how UK retailers typically compare. And with competing on hourly pay no longer an option for many businesses, I’ll also cover what actually moves the needle on retention.
What does retail turnover rate mean?
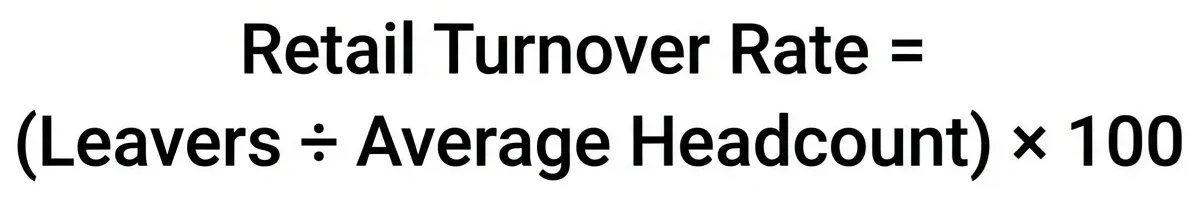
Retail turnover rate is the percentage of employees who leave over a set period (usually 12 months). In its simplest form: Turnover rate = leavers ÷ average headcount × 100.
Retail typically runs hotter turnover because frontline roles, part-time mixes, and seasonal peaks create constant movement. So tracking this metric only helps if you calculate it consistently and look at it by store, role, and tenure.
I prefer to split turnover two ways, because they tell you different things:
- Total turnover: planning and resourcing
- Voluntary turnover: your retention signal (the bit you can usually influence fastest)
For a wider view of why employees leave (and what typically moves the needle), see Why your employees are leaving and what you can do about it
Why does retail turnover rate matter?
When turnover is high, you pay for it in five ways:
- Money: every leaver triggers hiring, training, cover and lost productivity costs that add up fast
- Time: managers spend more hours hiring and training
- Productivity: it takes weeks for new starters to reach full pace
- Morale: remaining staff carry more load and are at a higher risk of burnout
- Service: customers notice inconsistency on the shop floor and lower product knowledge
What is the average retail turnover rate in the UK?
The CIPD’s latest churn analysis puts average UK turnover across the economy at 34% between January 2022 and December 2023, and the closest retail-adjacent grouping in the same CIPD/ONS dataset - wholesale, retail and repair of motor vehicles - is higher at 41.6% That’s labour-market churn, not employer-reported HR turnover, so use it as a reference point, not a KPI to chase.
ONS data shows vacancies have eased since their 1.3 million 2022 peak, so it’s not quite as frictionless to jump ship as it was. Turnover in retail still runs hot, though, because switching costs are low. When roles look and feel similar across the high street, people will move for a few pence more an hour, and with wage floors risin,g it’s harder to differentiate purely on base pay.
If you’re forced to put a pin in it, a sensible estimate for UK retail sits around 40–45%. But the more useful benchmark is your own trend, split by store, role, and tenure, and using the same definition over the same period - because that’s where the hotspots show up, and that’s what you can actually change.
If you want a quick baseline comparison before you segment by store and role, read our breakdown of employee turnover by industry and then benchmark your hotspots internally.
How do you calculate retail turnover rate and retention rate?
Headcount moves around too much in retail to wing this. Pick a method, label it, and stick with it, otherwise you’ll just waste time arguing about the number instead of fixing the problem.
Before you start, be clear on two things:
- Your period: 12 months is best for annual reporting, but a rolling monthly view helps you spot store-level issues early.
- What counts as a leaver: decide whether you include internal transfers, end-of-contract exits, and long-term absences, then keep that definition consistent.
How to calculate turnover rate
Average headcount = (headcount at start of period + headcount at end of period) ÷ 2
Turnover rate (%) = (number of leavers ÷ average headcount) × 100
How to calculate retention rate (simple “stayers” method)
This uses the “stayers” approach: of the people you started with, how many are still employed at the end of the period.
Retention rate (%) = ((end-of-period headcount − new hires during the period) ÷ start-of-period headcount) × 100
Worked example
Headcount at start of year - 120
Headcount at end of year - 80
New hires during year -15
Leavers during year - 35
Average headcount - (120 + 80) ÷ 2 = 100
Turnover rate - (35 ÷ 100) × 100 = 35%
Retention rate (stayers-based) - ((80 − 15) ÷ 120) × 100 = 54.2%
Some teams also track 90-day or 6-month retention for new starters - the calculation is the same, just over a shorter window.
One thing to watch out for: using only start or end headcount can make your turnover look artificially high or low around peak trading and seasonal shifts. Use an average headcount to keep the calculation stable and comparable over time.
Once you’ve got the number, don’t stop there - look at where it’s actually coming from. The overall rate is a headline; the segmented view tells you what to fix. If it’s concentrated in the first 8 to 12 weeks, you don’t have a retail problem. You have an induction, rota, or manager capability problem.
What is a good turnover rate in retail?
Basically, a good turnover rate is one you understand. You know where it’s coming from, why it’s happening, and what you’re doing to bring it down.
I look at three things. First, is it improving over time? One good month isn’t enough. Second, are we stable where stability matters most? As in the people who run shifts, train new starters, and keep standards consistent. Third, are there repeat problems that, over time, we’ve just accepted are “how that place is”?
What “good” looks like will vary depending on how you operate, your store format, part-time mix, seasonal peaks, and the labour market you’re hiring into. That’s why a headline average is a weak test. If you’re forced to pick a target, start by beating your own trend, then use the national numbers as a sense-check, not a finish line.
If you want to establish if you’re in a good place, better to ask:
- Are we improving year-on-year, or just cycling through the same pain?
- Are we losing people early before training has even paid back?
- Where are we forcing managers into constant recruitment mode instead of running the business?
- Are the exits clustered around certain leaders, certain rotas, or certain ways of working?
If you want to get ahead of turnover, watch the indicators that move first:
- Rota stability: late changes, inconsistent hours, and weekend fairness
- Manager stability: constant leadership changes create churn underneath them
- Workload and standards: when teams are stretched, the job becomes harder and people leave
- Progression and recognition: if good performance isn’t noticed or rewarded, you lose your best people first
When it comes to it, there isn’t one magic percentage. Retail has always been hard for retention. “Good” is when you’re getting it under control.
Why is retail staff turnover so high?
Retail turnover runs higher than many other sectors because structural pressures collide with the day-to-day reality of the job. The drivers usually come down to:
- Pay competitiveness
- Flexibility and schedule predictability
- Progression and development
- Wellbeing, safety, and frontline abuse
- Management quality and day-to-day experience
- Recognition and respect
A simple turnover spiral I see a lot is when a competitor opens nearby with slightly higher pay and more predictable shifts. You lose a few experienced people and a couple of new starters.
Overtime rises, rotas get messier, managers spend more time covering gaps, and the job gets harder for the people who stay… which drives the next wave of exits.
Lack of flexibility (or unpredictable schedules)
Most retail roles have to be done in-store, so when people say they want “flexibility”, they usually mean predictability: enough notice of shifts, hours that don’t swing wildly week to week, and a fair share of late shifts and weekends. When rotas feel chaotic or unfair, people start looking elsewhere.
No clear career development path
Retail builds real, transferable skills, but if your people can’t see a credible next step, they won’t hang around waiting for one. It gets worse when “progression” effectively means less flexibility, more pressure, and a jump in responsibility that doesn’t feel worth it.
If progression is part of your retention plan, it helps to define clear pay steps. Read our salary band structure guide to build progression that’s transparent and explainable.
Health, well-being, and safety on the frontline
Frontline retail can be emotionally demanding, and if people don’t feel safe or that they don’t have the right support when something happens, they won’t stay. Customer abuse isn’t just “part of the job”. It’s a major retention issue if mishandled.
Retail Trust’s 2025 Retail People Index reported that 54% of retail workers were a “flight risk”, reflecting the scale of wellbeing pressure in the sector. Worse, the Association of Convenience Stores’ Crime Report 2025 estimates there were 1.2 million incidents of verbal abuse and over 59,000 incidents of violence in the convenience sector over the last year. Safety and support can’t be treated as optional.
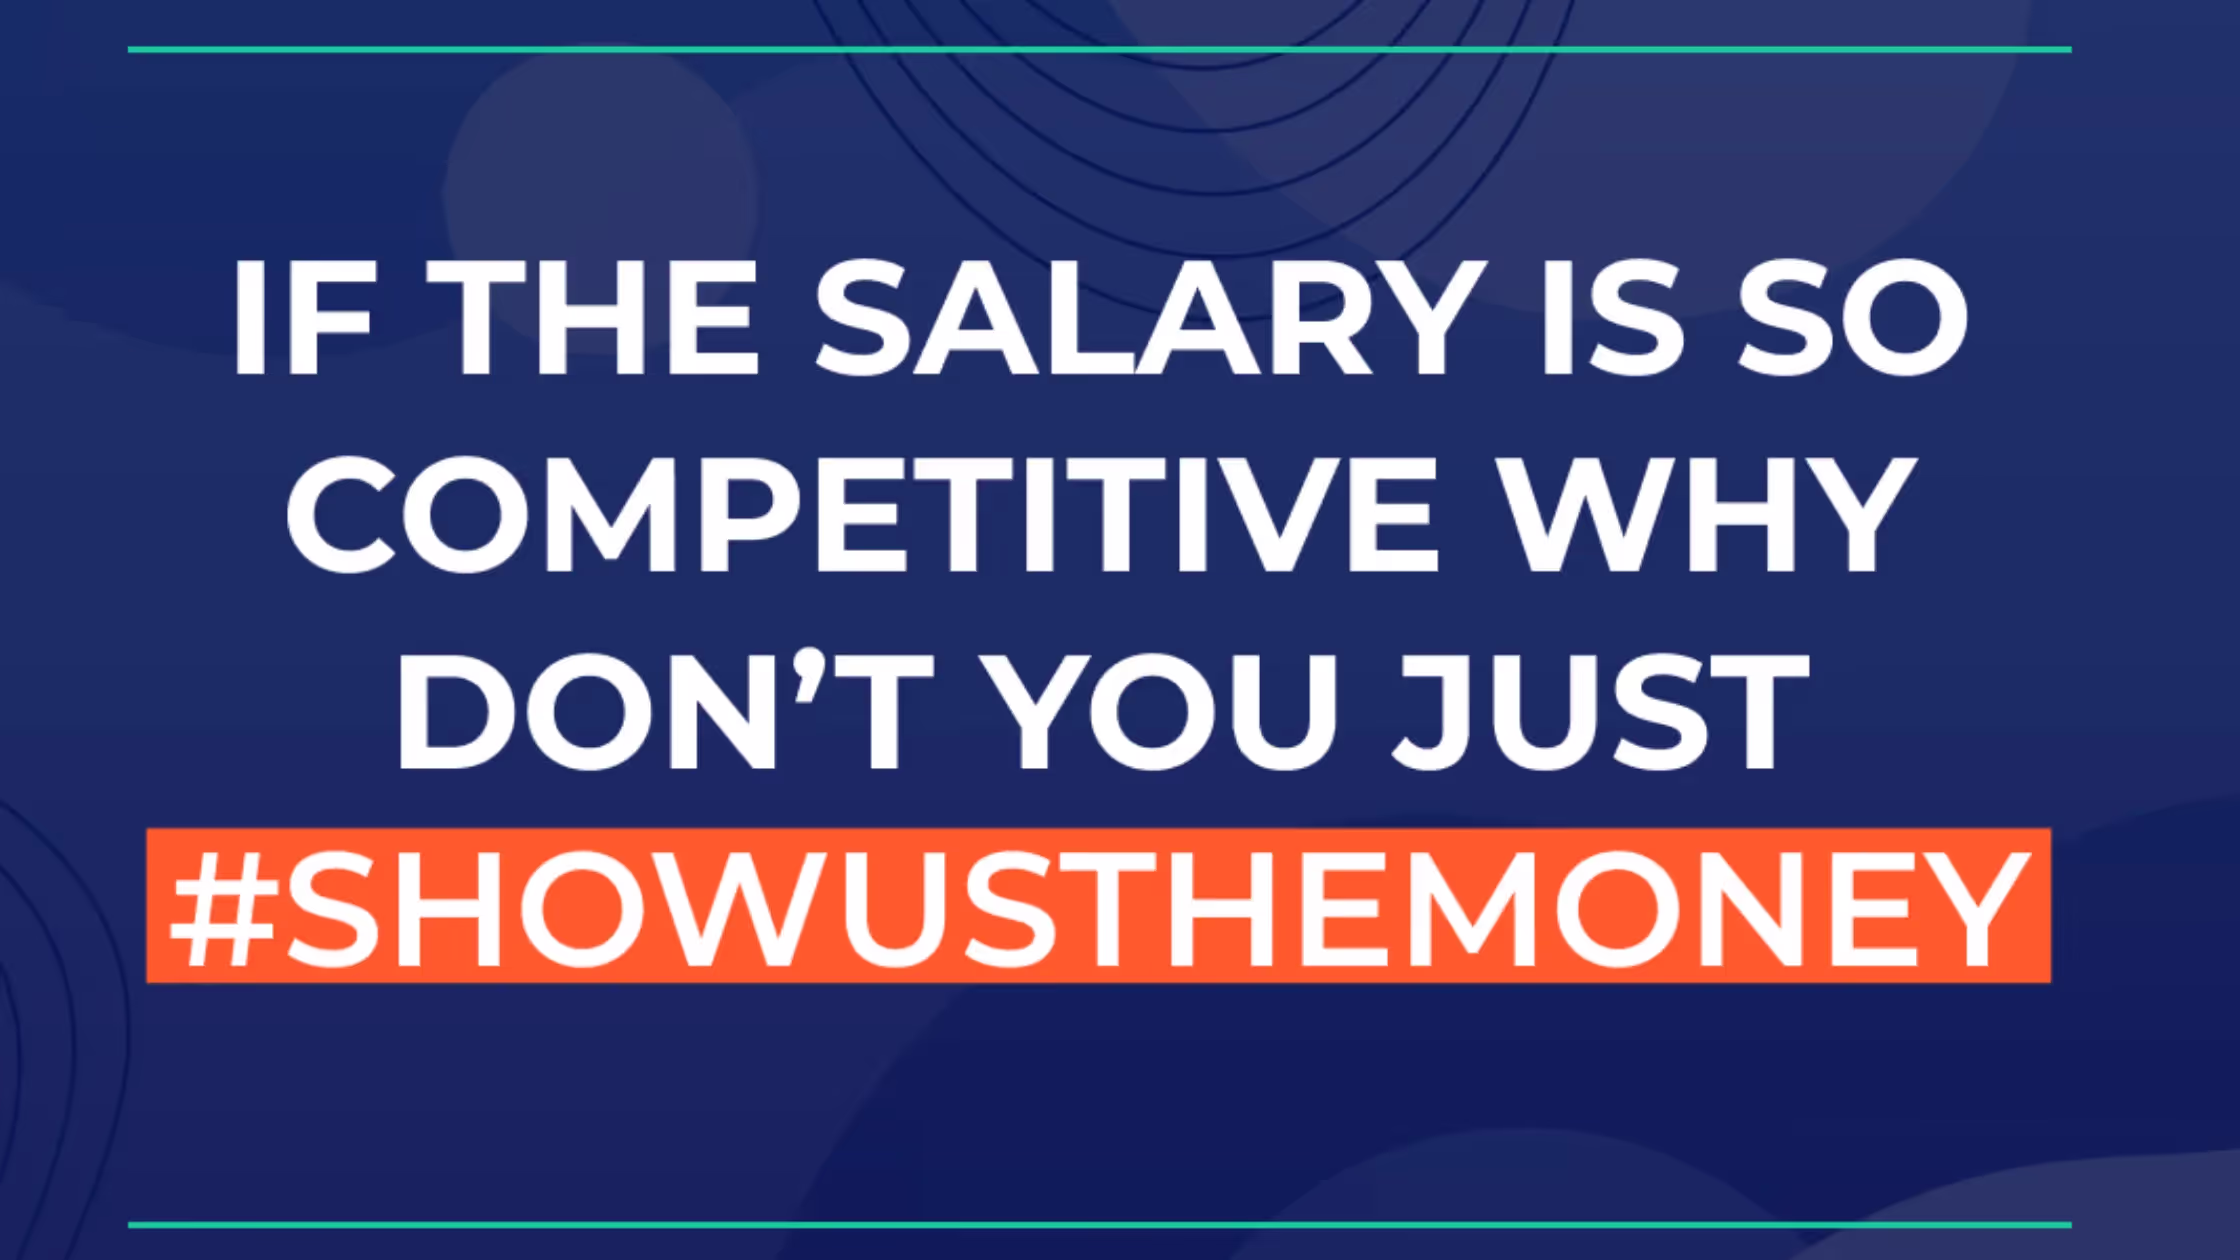
Low compensation (or uncompetitive pay)
Pay isn’t the only reason people leave, but it’s the easiest one to act on. If someone can get paid 50p more per hour for a similar role, they will.. And pay compression kills you quietly: when new starters join at nearly the same rate as the role above, you’re telling your best staff their loyalty is worth pennies.
With recent increases to the National Living Wage, this has become a huge pressure point for retailers across the UK. For many, it’s just not affordable to raise salaries across the board to accommodate the baseline uplift. If your pay scales compress, then no one’s going to want to take on lots more responsibility for an extra £1 per hour.
In a lot of retail roles, pay is pretty much tied to the minimum legal amount. ONS data shows a heavy concentration of jobs paid around the National Living Wage, and Living Wage Foundation analysis indicates that 30% of employee jobs in the wholesale and retail sector are paid below the real Living Wage.
One of the best ways to fight churn is to get competitive where it matters by using a trusted data source to validate your pay against the market. Make sure experience still pays, because it’s not fair to your people to end up doing more work for nearly the same pay as entry-level workers. And be honest about pay in your job ads, because that matters too - take a look at our breakdown of the pay transparency in the UK to see how you compare.
Lack of meaning and recognition
“Meaning” in retail comes down to whether people feel respected, backed up, and noticed - especially when it’s busy and the job is hard. If the work is all pressure and no appreciation, people stop caring, and then leave.
As McKinsey pointed out, meaningful work is one of the top five motivators for frontline retail employees. If you get all of the other drivers here wrong, people will find the work meaningless and start looking elsewhere.
How to improve retail employee retention rate
Retail retention doesn’t improve because you run a one-off initiative. It improves when you tighten the day-to-day in-store experience, focus your spend where it actually changes behaviours, and get an early understanding of what’s driving exits before churn becomes a cycle.
Make your schedules predictable (and fair)
In retail, “flexibility” often means predictability. Give people enough notice to plan their lives, reduce late changes, and make sure weekends and late shifts are shared fairly.
Late rota changes are the pressure. High 90-day turnover rates are the fallout. If you see rota changes inside 7 days creeping up, expect more early exits.
Build visible progression (and invest in training)
Turn progression into something people can point to, not something you only talk about in job interviews. Make the pathway simple and shout about it. Spell out what “ready for promotion” looks like, and make internal moves easy to spot so progression feels achievable.
Track internal fill rate and time-to-promotion. If those stall, you’ll feel it in supervisor and manager stability soon after.
Fix pay competitiveness for priority roles
Fix pay where it’s losing you people. If your competitors consistently pay more for the same job, you’re just training staff for someone else. Get clear on your local rates, and set pay steps people can actually progress through. Watch offer acceptance and what leavers say about pay.
A quick sense-check is to compare local salary benchmarks against the roles and locations where churn is highest. If you’re not sure about the best way to assess them, read our guide on salary benchmarking.
Raise the floor on day-to-day leadership in store
Turnover is often a store-level experience problem. Tighten the basics: consistent onboarding check-ins, fair treatment, clear expectations, and managers who have the time and support to lead rather than being stuck constantly putting out fires.
Track store-to-store turnover variance and absence/overtime patterns; they’re usually the earliest warning signs of a team under strain.
Treat values, fairness, and safety as retention issues (not just comms)
For a big chunk of the retail workforce, especially younger employees, diversity and inclusion (D&I) and Environmental, Social, and Governance (ESG) aren’t mere side topics. The point is proof. People notice whether fairness is real in pay, progression, and day to day treatment, not whether you have a poster campaign.
I’m not talking abstracts here. A 2025 UK study by IRIS Software Group found nearly 60% of workers would consider quitting if their employer rolled back DEI commitments, rising to 68% for Gen Z.
The same is true for ESG. According to Opinium CEO James Endersby, their data showed 43% of 18 to 34-year-olds would leave if their employer’s values did not align with their own on ESG.
This also ties back to safety, because that’s where values stop being words and become behaviour.
If you need more ideas on how to hang on to your employees for longer, take a look at our employee retention strategies guide for practical changes that reduce avoidable churn.
Improve your employer brand to improve your retention rate
Employer brand affects retention because it sets expectations.
These days, the only credible story is one people can verify quickly. That means being clear on what you can offer, and consistent in delivering it. Be transparent about:
- How schedules work in reality
- How progression actually happens, not just that it exists
- What “good management” looks like across stores
- What happens when colleagues face abuse or safety issues
- How pay decisions work, even if you cannot always be the highest payer
Communicate the basics clearly, and often: progression, scheduling, pay approach, and your stance on wellbeing and safety. Then back it up with proof people can easily recognise.
Retail turnover FAQs
What is the turnover rate in UK retail?
It is the percentage of employees who leave over a set period, usually 12 months. Retail rates tend to be higher than many sectors because roles are frontline, shift based, and easy to move between.
What is a good turnover rate in retail?
There is no single good number. “Good” is when turnover is moving in the right direction and you are not constantly losing experience in the roles that keep stores running.
How do I calculate retail turnover rate?
Calculate average headcount for the period, then divide leavers by average headcount and multiply by 100:
Average headcount = (Start headcount + End headcount) ÷ 2
Turnover rate (%) = (Leavers ÷ Average headcount) × 100
How HR DataHub helps retailers act on turnover drivers
It's a lot easier to manage turnover when you can see if people are leaving because the pay isn't competitive for their role or location. HR DataHub helps retail teams like yours to:
- Benchmark pay locally for priority roles
- Set defensible pay ranges and monitor drift over time
- Prioritise where pay is most likely contributing to churn
If pay is part of the churn story, you need a clear view of what competitors are paying nearby, not last year's survey figures. HR DataHub gives you live market rates by role and location - start a free trial today to see where you're losing ground.

LATEST WEBINAR

View our library of resources tailored to help you do X, Y & Z


Read through more blogs
.jpg)

%2520(1).webp)


.jpeg)

.jpeg)


.jpeg)


.jpeg)

.avif)
.webp)
.avif)
.avif)
.avif)
.webp)
.webp)
.webp)
.avif)