Sector pay trends 2026: How advertised pay moved for UK operational roles


Advertised pay for heavy goods vehicle (HGV) Class 2 drivers rose 13.6% in the 12 months to September 2026, according to our Operational Pay Trends data. That's the fastest move of any role in this piece, in a sector where the 11 roles we track moved 8.9% on average.
Employers planned a median 3.0% award for 2027, according to our 2027 Pay Planning Survey. Advertised pay for 38 of the 48 roles we track moved more than 3%, so the pay review you're planning now starts behind the market.
Below is each sector's 12-month picture, with the roles to check first before you set your 2027 pay budget.
Sector pay trends at a glance
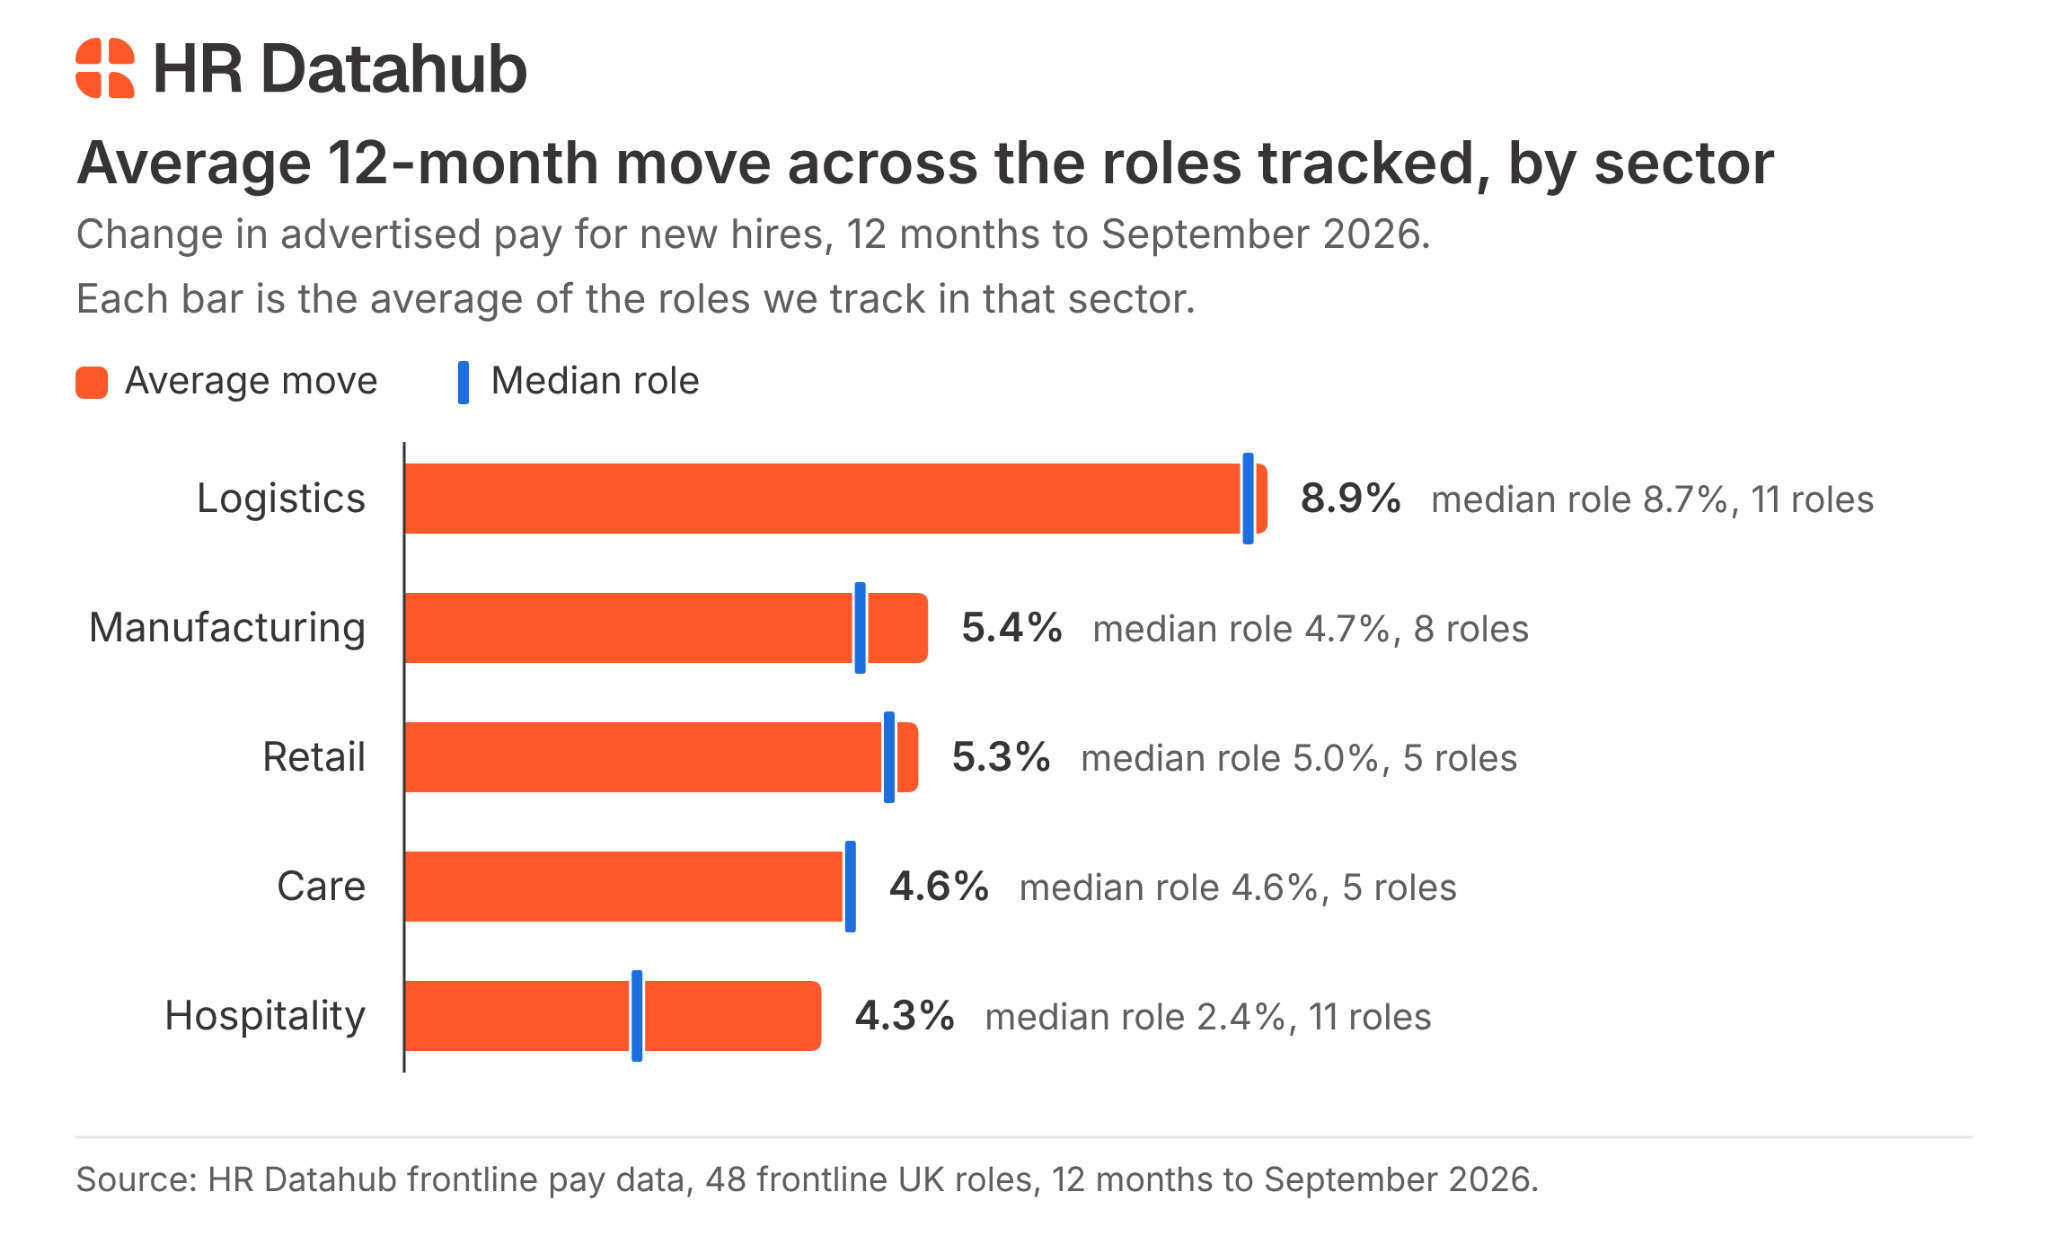
- Logistics moved fastest of the five sectors, with advertised pay up 8.9% on average across the 11 logistics roles in our operational pay data.
- The median role across the 48 operational roles we track moved 5.2% in the 12 months to September 2026.
- Of the 48 roles we track, 16 moved 7% or more, and nine moved 10% or more.
- Hospitality has the biggest gap between its fastest role and its median role, with commis chefs' advertised pay up 11.9% while the median hospitality role moved 2.4%.
- In care, advertised pay for nurses outside the National Health Service (NHS) rose 9.1%, while support workers outside the NHS moved 0.5%.
UK pay movement by sector: The 12-month picture
Logistics led the five sectors on average advertised pay over the 12 months to September 2026, while hospitality and care moved least, as our operational pay data shows. The table sets out each sector's average move, median role and fastest-moving named role.
Logistics pay trends: HGV and van drivers moved fastest
HGV and van drivers led the logistics roles named here in the year to September 2026. Advertised pay for HGV Class 2 drivers rose 13.6%, Class 1 drivers 10.2% and van drivers 10.0%, according to our operational pay data. The 11 logistics roles we track averaged 8.9%, with the median role at 8.7%.
Warehouse and planning roles moved more slowly in our operational pay data, with forklift drivers at 4.3%, warehouse operatives at 3.9% and transport planners at 1.8%.
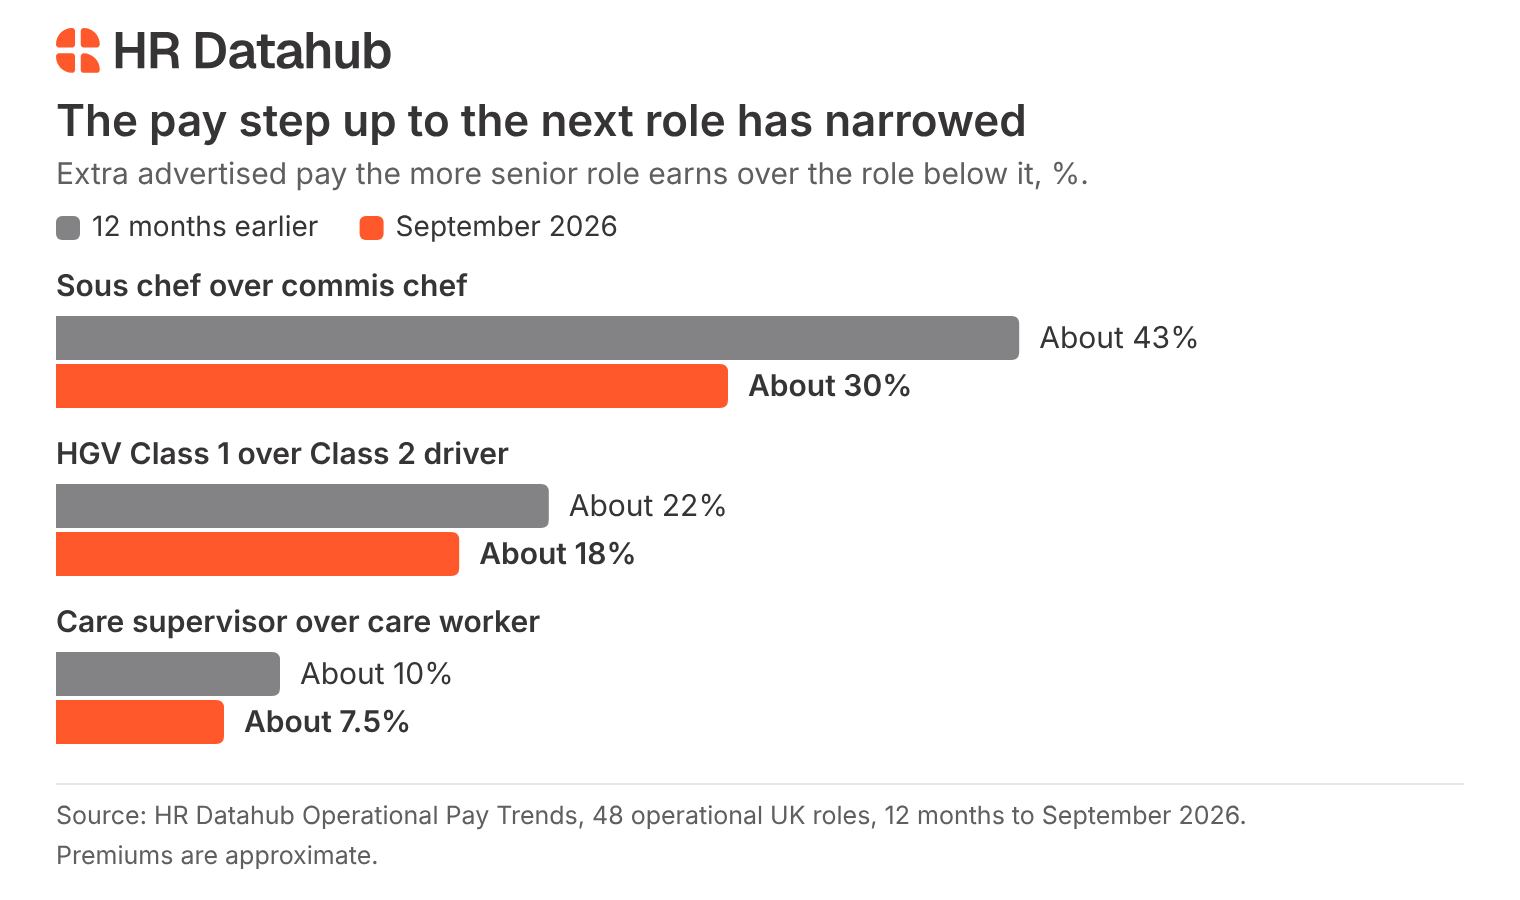
The extra pay a Class 1 driver earns over a Class 2 driver has narrowed to about 18%, down from about 22%, according to our operational pay data. If you rely on Class 1 drivers, that's the gap to look at first.
Transport and distribution employers planned an average 3.2% award for 2026, according to our 2026 Pay Planning Survey, a figure from a small group of employers and well below what the market now offers drivers.
For pay levels by role, see our guide to the average logistics salary. With HR Datahub, you can see what employers offer drivers in the locations you hire, so offers land first time and hold up when finance asks why.
Logistics roles named in this piece. The 8.9% average and 8.7% median cover all 11 logistics roles we track, three more than the table lists.
Manufacturing pay trends: Production managers pulled ahead
Advertised pay for production managers rose 10.4% in the 12 months to September 2026, the fastest move among the eight manufacturing roles in our operational pay data. Production supervisors followed at 6.9%, and the manufacturing average was 5.4%, with the median role at 4.7%.
Assemblers and production operatives both rose 4.4%, machine operators 3.5% and fabricators 3.3%, according to our operational pay data.
HR Datahub's 2027 Pay Planning Survey of 146 UK employers (September to October 2026) shows what employers gave existing staff. Industrial employers (manufacturing, construction and engineering, energy and utilities) gave a mean award of 3.49% in 2026. That's a sector-group figure, well below the 5.4% average across the eight manufacturing roles in our operational pay data.
If you're short of production managers, start with that role, as the gap with the market is likely widest there.
Retail pay trends: Supervisors outpaced the shop floor
Retail supervisors saw the fastest rise of the retail roles named here, with advertised pay up 5.3% in the 12 months to September 2026, according to our operational pay data. Retail merchandisers followed at 5.0% and assistant store managers at 4.5%, while sales assistants moved 2.8%. The average across the five retail roles we track was 5.3%, and the median role sat at 5.0%.
Retail employers planned an average 3.0% award for 2026, according to our 2026 Pay Planning Survey. Three of the four retail roles named here moved faster than that plan.
With supervisors moving almost twice as fast as sales assistants, check that the step up into supervision still pays enough to attract your best shop-floor staff. For pay levels by role, see our guide to the average retail salary.
Retail roles named in this piece. The 5.3% average and 5.0% median cover all five retail roles we track, one more than the table lists.
Hospitality pay trends: Kitchen entry roles moved fastest
Commis chefs and kitchen porters, the entry roles in a kitchen, saw the biggest rises in hospitality pay over the 12 months to September 2026. Their advertised pay rose 11.9% and 11.2%, according to our operational pay data. Higher up the kitchen, cooks rose 2.4%, head chefs 2.2% and sous chefs 1.8%.
Across the 11 hospitality roles in our operational pay data, the average move was 4.3% and the median role moved 2.4%. Waiters and waitresses moved 0.9%, the slowest hospitality role named here.
Hospitality and leisure employers planned an average 2.8% award for 2026, according to our 2026 Pay Planning Survey. That's above the 2.4% median role but well below the 4.3% average.
The extra pay a sous chef earns over a commis chef has narrowed to about 30% in our operational pay data, down from about 43%. HR Datahub lets you check every level of your kitchen against the live UK market, so your pay structure still rewards progression.
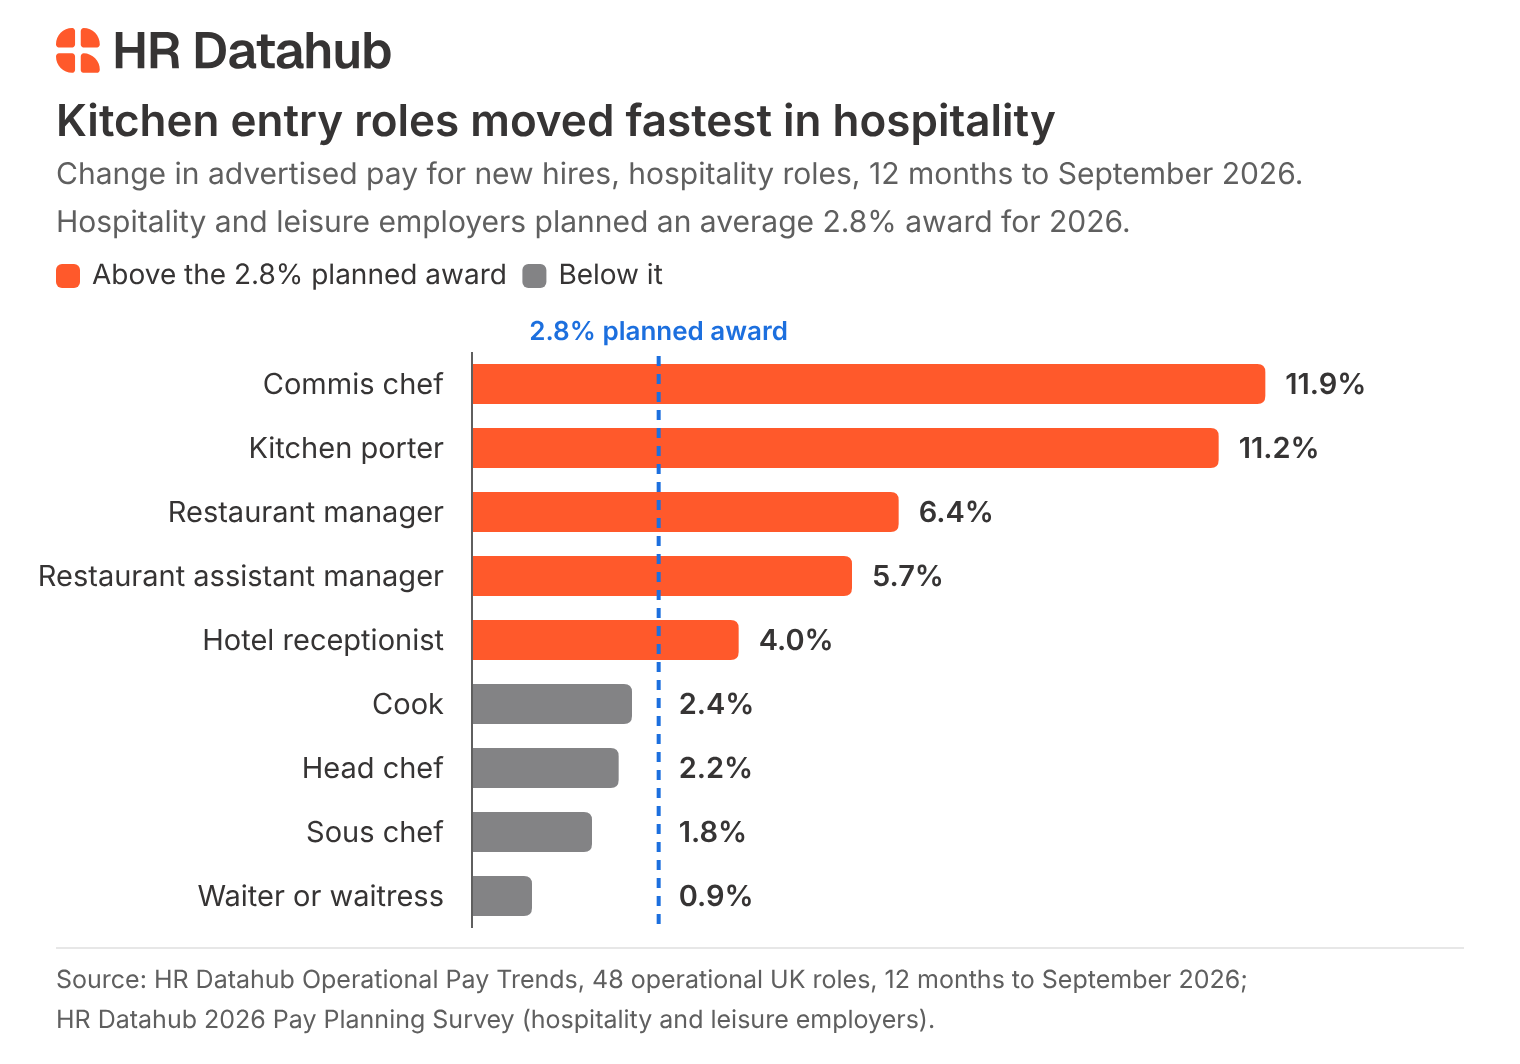
Hospitality roles named in this piece. The 4.3% average and 2.4% median cover all 11 hospitality roles we track, two more than the table lists.
Care pay trends: Non-NHS nurses led, non-NHS support workers stayed flat
Nurses working outside the NHS led care pay trends, with advertised pay up 9.1% in the 12 months to September 2026, according to our operational pay data. Care workers followed at 7.3%, while advertised pay for support workers outside the NHS rose 0.5%.
Care supervisors sat in the middle at 4.6%, which is also the average and the median across the five care roles in our operational pay data.
Because care workers moved faster than their supervisors, the extra pay a care supervisor earns over a care worker has narrowed to about 7.5%, down from about 10%, as our operational pay data shows. That's a thin margin for taking charge of a care team, so it's worth reviewing supervisor pay before your next round of care worker offers.
Likely reasons advertised pay outran 2026 pay budgets for most roles
The likely reasons are the National Living Wage at the bottom of the pay scale and shortages in hard-to-fill roles. Together they likely pushed advertised pay for most of the roles in our operational pay data ahead of the pay budgets employers set for 2026, while pay for people already in jobs grew more slowly.
Regular pay for existing employees rose 3.7% in June to August 2026, and 3.0% in the private sector, according to the Office for National Statistics (ONS) average weekly earnings bulletin.
The National Living Wage rose 4.1% from April 2026, according to the Low Pay Commission's recommendation, and employers lifting entry pay to stay above it likely raised advertised rates for roles such as kitchen porters.
Operational services employers (retail, hospitality, transport and distribution) gave existing staff a mean award of 2.96% in 2026, the lowest of the four sector groups in our 2027 Pay Planning Survey. They expect 3.40% in 2027. That's a directional read on 22 answers, and it puts the lowest award budgets in the sectors where several of the fastest-moving roles sit.
How we measured sector pay trends
We measured these sector pay trends with HR Datahub's Operational Pay Trends data, which tracks advertised pay for 48 operational roles from over 260,000 data points, September 2025 to September 2026. For each role, we measure the 12-month change in advertised pay, and each sector figure is the average of the roles we track in that sector.
The result shows which roles in your sector moved fastest, so you can check those roles first in your next pay review.
These points help when you read the sector pay trends figures:
- The data measures advertised pay for new hires in job adverts for a selected set of operational roles, a narrower set than measures built on all job postings.
- Each sector table shows the roles named in this piece, while every average, median and count covers all the roles we track.
- Roles quoted by the hour moved 3.5% on average, against 7.5% for salaried roles.
What to check before your next pay review
Your next pay review is where you test your budget against what the market now pays. Work through these three checks in order:
- Check your fastest-moving roles first. Compare what you pay HGV drivers, commis chefs, nurses outside the NHS or your sector's equivalents with what the market now advertises.
- Bring market data into the budget. Only 32% of employers use market data when they set pay budgets, against 88% who cite affordability, according to our 2027 Pay Planning Survey. Role-level evidence gives finance figures you can defend.
- Protect the steps up. Where the premium for the next level has narrowed, as it has for Class 1 drivers, sous chefs and care supervisors, decide whether to restore it before you lose people at that level.
For the wider process, our guide to surviving pay review season walks you through each stage.
Frequently asked questions about sector pay trends
Is 3% a good pay rise in the UK?
A 3% pay rise falls behind both inflation and the market for most of the roles HR Datahub tracks. Consumer prices index (CPI) inflation was 3.5% in the 12 months to September 2026, according to the ONS consumer price inflation bulletin, so a 3% award is a real-terms cut.
Of the 48 operational roles HR Datahub tracks, advertised pay for 36 rose faster than that 3.5%, so a 3% rise is likely to leave pay trailing what other employers advertise.
Is there a pay rise in April 2026?
The April 2026 pay rise for the lowest paid came through the National Living Wage. It rose 4.1% to £12.71 an hour for workers aged 21 and over, according to the Low Pay Commission's 2026 recommendation, and applied from 1 April 2026.
The next rise follows in April 2027, when the National Living Wage goes up 3.9% to £13.21, as the government confirmed on 28 October 2026 when it accepted the Low Pay Commission recommendations.
How often is this sector pay data refreshed?
HR Datahub's Operational Pay Trends data refreshes every quarter, and this piece covers the 12 months to September 2026. The HR Datahub platform itself draws on job-posting data, updated daily, so you can check any role against the live UK market between refreshes.
How is advertised pay different from a pay award?
Advertised pay is what employers offer new hires in job adverts, while a pay award is the rise existing staff receive, usually measured as a share of the paybill. Comparing the two shows whether your awards keep pace with what it would cost to replace someone in the same role.
Check your key roles against live UK pay data
Employers gave a median 3.2% award in 2026, according to our 2027 Pay Planning Survey, and advertised pay for most of the roles we track has moved well past that. The gap is widest in roles many employers can least afford to lose, such as drivers, kitchen entry roles and nurses outside the NHS.
Employers who have set a 2027 budget expect a median 3% award for existing staff, according to our 2027 Pay Planning Survey, so the same gap could open again next year.
Before your next pay review, check your key roles against live UK pay data. HR Datahub gives you live UK pay evidence, updated daily, so your pay review rests on what the market is paying now.
LATEST WEBINAR

Guides, templates and tools to help you approach pay with more confidence, clarity and consistency.


Read through more blogs